Backfill support for Prometheus has been long requested and with the v2.24.0 release, is finally here!
Prometheus’ backfilling currently only supports the OpenMetrics format, which is a simple text (or protobuf) representation for metrics.
For example:
# HELP http_requests_total The total number of HTTP requests.
# TYPE http_requests_total counter
http_requests_total{code="200",service="user"} 123 1609954636
http_requests_total{code="500",service="user"} 456 1609954730
# EOF
… where HELP and TYPE are MetricFamily metadata giving a brief description of the metric family (set) and its data type. The http_requests_total metric family contains two metrics; both with comma-separated labels, a value and a timestamp (Unix time).
Note, the file (“exposition”) must end with EOF.
The new backfilling support is implemented as the create-blocks-from openmetrics subcommand to tsdb via promtool. Lets give it a try.
First ensure you’re running v2.24.0 or later. Binary releases are conveniently provided if it has yet to land in your distribution.
If we launch prometheus with its default configuration, a data directory is created with the following contents:
❯ tree data
data
├── chunks_head
├── lock
├── queries.active
└── wal
    └── 00000000

2 directories, 3 files
Lets run the backfill command:
❯ ./promtool tsdb create-blocks-from openmetrics metrics
BLOCK ULID                  MIN TIME       MAX TIME       DURATION     NUM SAMPLES  NUM CHUNKS   NUM SERIES   SIZE
01EVCJ6E3XKHCY35AEYYWQB61N  1609954636000  1609954730001  1m34.001s    2            2            2            805
The new block is created in the data directory (by default):
❯ tree data
data
├── 01EVCJ6E3XKHCY35AEYYWQB61N
│   ├── chunks
│   │   └── 000001
│   ├── index
│   ├── meta.json
│   └── tombstones
├── chunks_head
├── lock
├── queries.active
└── wal
    └── 00000000

4 directories, 7 files
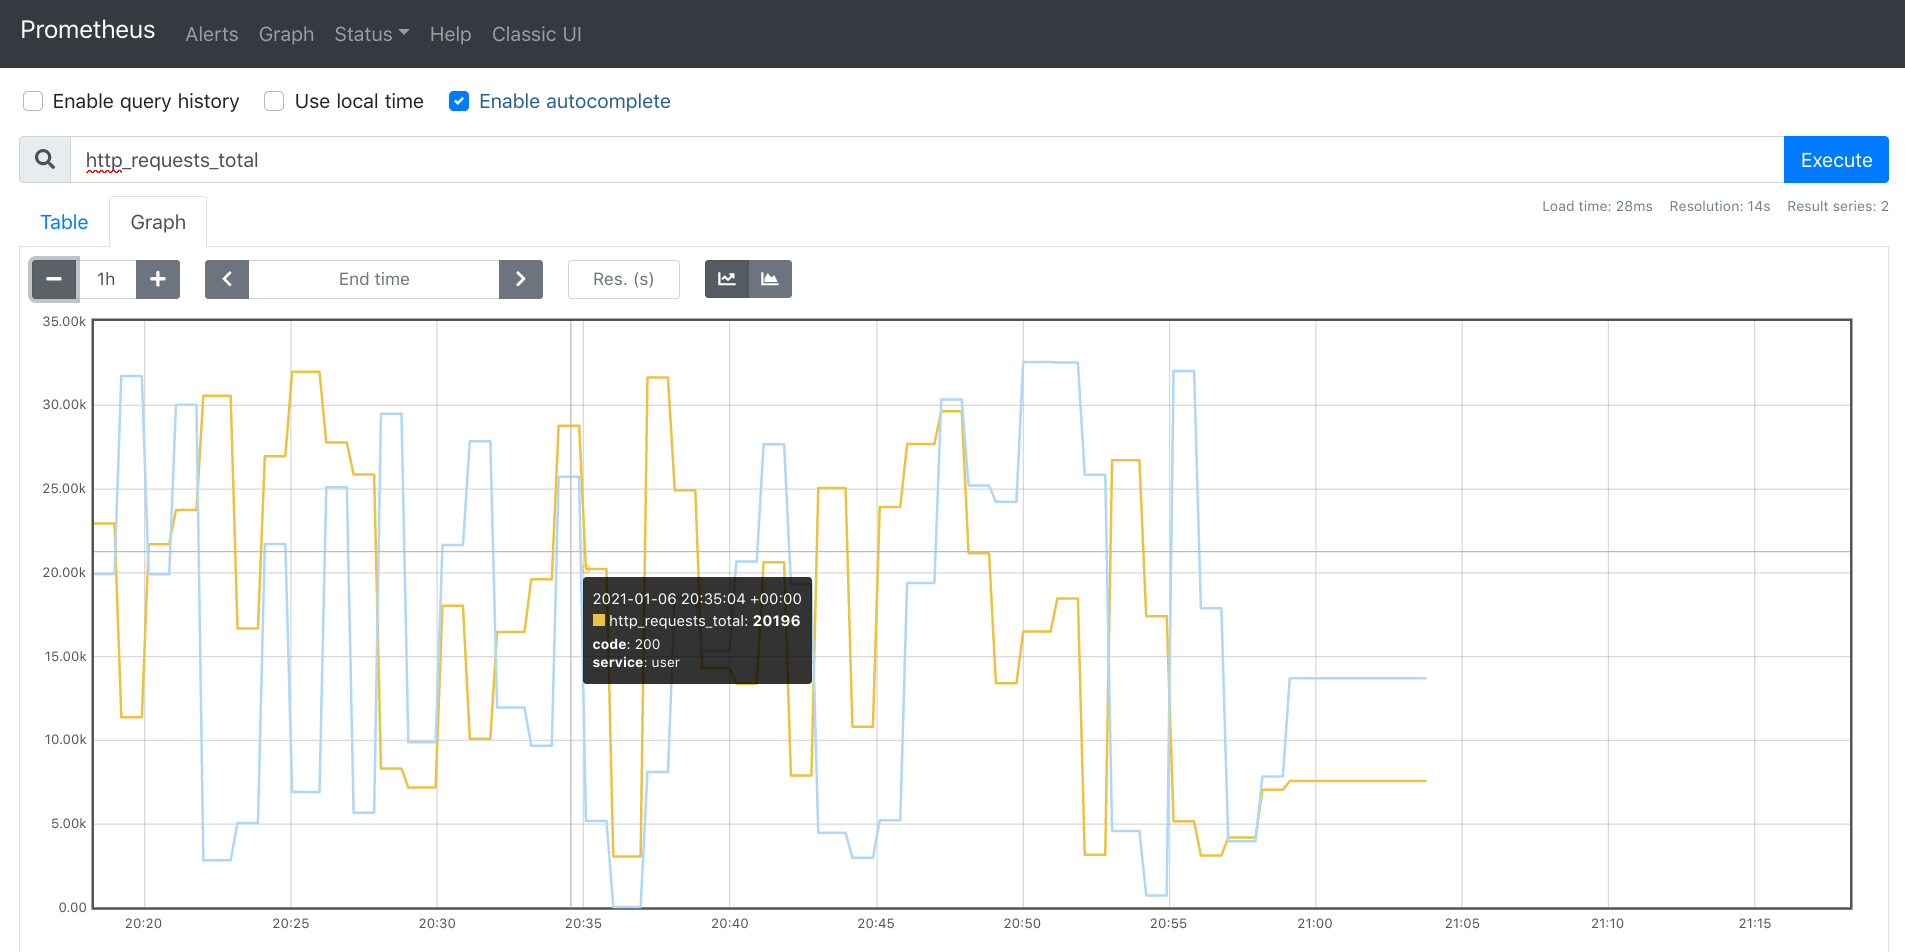
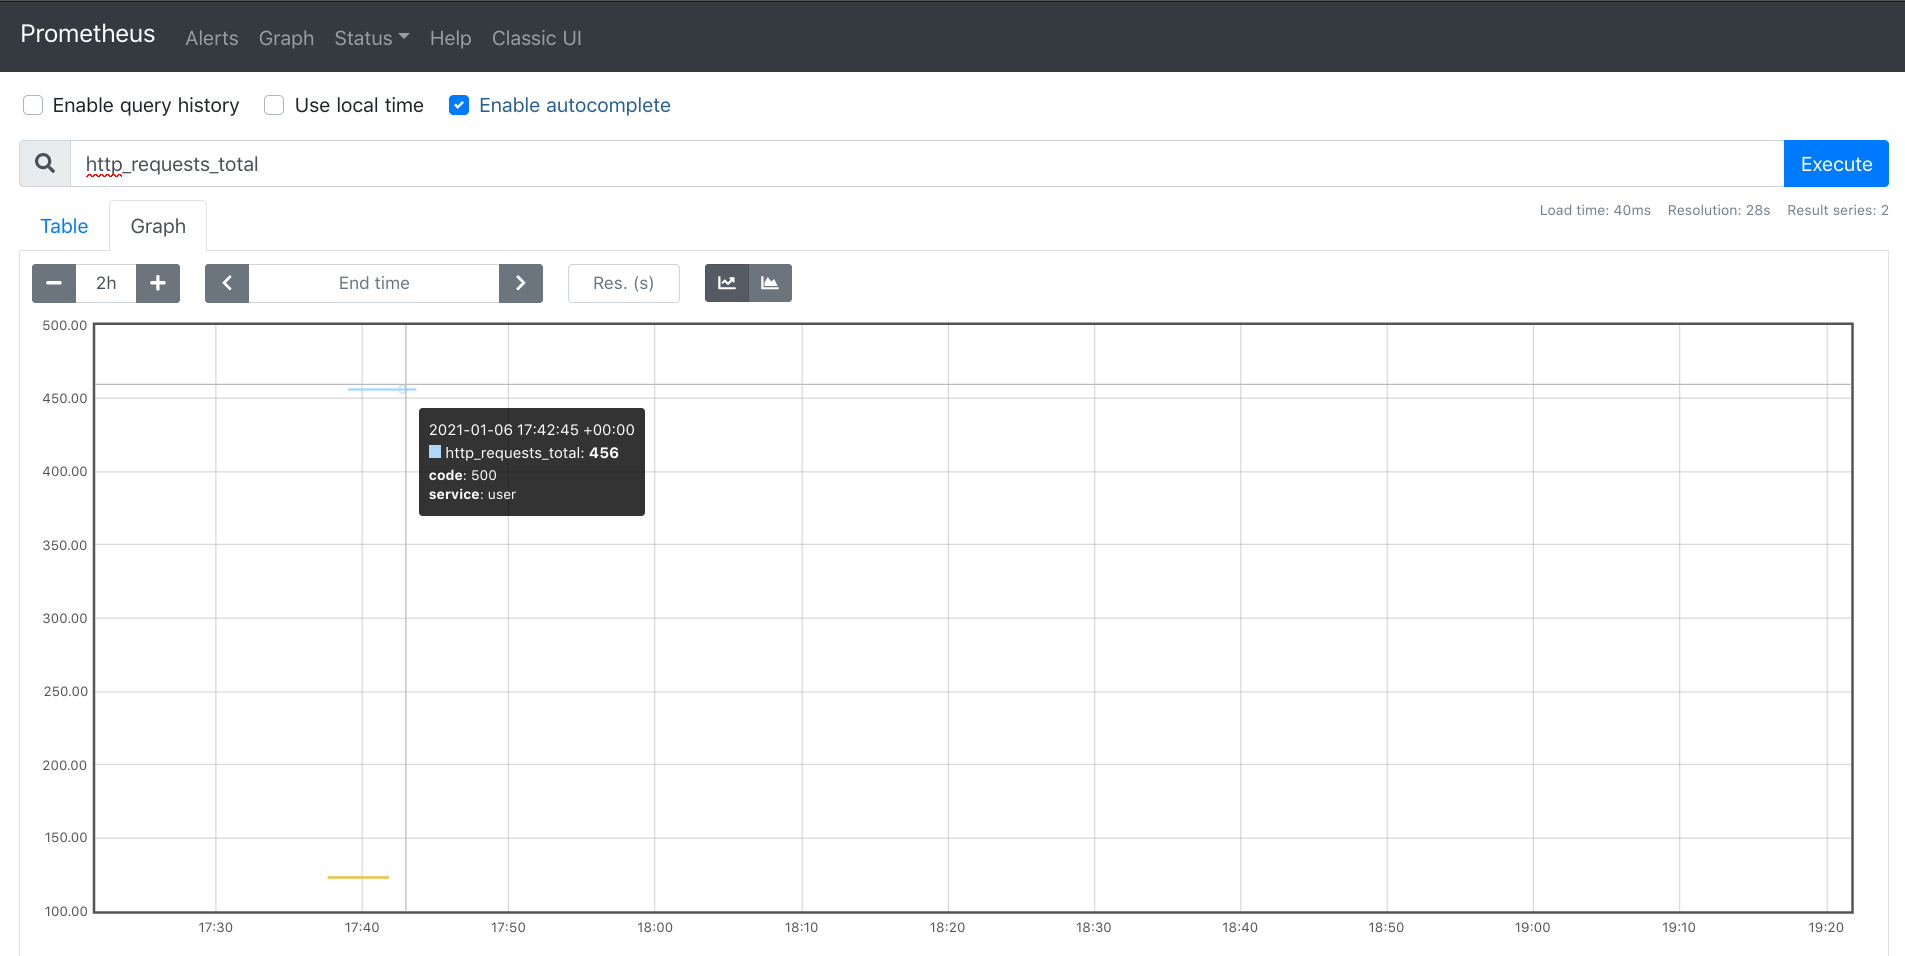
Restart prometheus, query on the http_requests_total metric name, switch to the graph view and there we have it; backfilled metrics.
Note, backfilled data is subject to the server’s retention configuration, both size and time. Set these to values that make sense for your data.
Why’s backfilling useful? Some ideas:
#!/usr/bin/env bash
set -euo pipefail

hour="$(( $(date +%H) - 1))"
dateHour="$(date -I)T$(printf %02g $hour)"

cat << EOF
# HELP http_requests_total The total number of HTTP requests.
# TYPE http_requests_total counter
EOF

for i in {0..59}; do
  for status in 200 500; do
    echo "http_requests_total{code=\"$status\",service=\"user\"} $RANDOM $(date -d "${dateHour}:$(printf %02g "$i"):00" +%s)"
  done
done

echo "# EOF"